Howdy, Stranger!
It looks like you're new here. If you want to get involved, click one of these buttons!
Quick Links
Coarse polygon border after flattening a cell

I am creating a structure having curved boundaries by first creating a PCell with python scripting.
Here is its appearance:
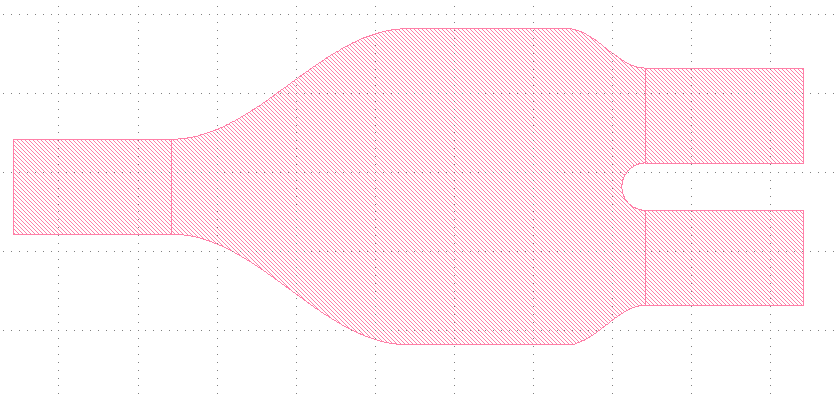
The curved parts are simply the cosine and circle profiles and present no problem to define in the script:
`
import pya
import math
class Y_splitter(pya.PCellDeclarationHelper):
def init(self):
# Important: initialize the super class
super(Y_splitter, self).__init__()

# declare the parameters
self.param("l", self.TypeLayer, "Layer", default = pya.LayerInfo(1, 0))
self.param("s", self.TypeShape, "", default = pya.DPoint(0, 0))
self.param("n", self.TypeInt, "Number of points per curve", default = 64)
self.param("L1", self.TypeDouble, "L1", default = 1.5)
self.param("L2", self.TypeDouble, "L2", default = 1.0)
self.param("L3", self.TypeDouble, "L3", default = 0.5)
self.param("W", self.TypeDouble, "Width", default = 1.6)
self.param("d", self.TypeDouble, "out_wg_dist", default = 0.9)
self.param("wg_width", self.TypeDouble, "base_width", default = 0.6)
self.param("wg_length", self.TypeDouble, "wg_length", default = 1)
def display_text_impl(self):
return "Y-splitter(L=" + str(self.l) + ",lambda=808 nm" + ")"
def coerce_parameters_impl(self):
pass
def can_create_from_shape_impl(self):
return False
def parameters_from_shape_impl(self):
self.r = self.shape.bbox().width() * self.layout.dbu / 2
self.l = self.layout.get_info(self.layer)
def transformation_from_shape_impl(self):
return pya.Trans( self.shape.bbox().center() )
def produce_impl(self):
dbu = self.layout.dbu;
ly = self.layout
shapes = self.cell.shapes

L1 = self.L1/dbu;
L2 = self.L2/dbu;
L3 = self.L3/dbu;
W = self.W/dbu;
d = self.d/dbu;
wg_width = self.wg_width/dbu;
wg_length = self.wg_length/dbu;

pts = []
dx1 = L1/self.n;
for i in range(0, self.n+1):
  pts.append(pya.Point.from_dpoint(pya.DPoint(i*dx1, (W+wg_width)/4-(W-wg_width)*math.cos(math.pi*i*dx1/L1)/4  )))

dx3 = L3/self.n;
for i in range(0, self.n+1):
  pts.append(pya.Point.from_dpoint(pya.DPoint(L1+L2+i*dx3, (W+wg_width+d)/4+(W-wg_width-d)*math.cos(math.pi*i*dx3/L3)/4  )))

if d>wg_width:
   rad = (d-wg_width)/2;
   dphi = math.pi/2/self.n;
   for i in range(0, self.n+1):
    pts.append(pya.Point.from_dpoint( pya.DPoint(L1+L2+L3-rad*math.sin(dphi*i) , rad*math.cos(dphi*i)) ))

   for i in range(0, self.n+1):
    pts.append(pya.Point.from_dpoint( pya.DPoint(L1+L2+L3-rad*math.cos(dphi*i) , -rad*math.sin(dphi*i)) ))

for i in range(self.n, -1, -1):
  pts.append(pya.Point.from_dpoint(pya.DPoint(L1+L2+i*dx3, -(W+wg_width+d)/4-(W-wg_width-d)*math.cos(math.pi*i*dx3/L3)/4  )))

for i in range(self.n, -1, -1):
  pts.append(pya.Point.from_dpoint(pya.DPoint(i*dx1, -(W+wg_width)/4+(W-wg_width)*math.cos(math.pi*i*dx1/L1)/4  )))

center_region = pya.Polygon(pts);
input_wg_box = pya.Box(-wg_length, -wg_width/2, 0, wg_width/2);
output_wg_poly_1 = pya.Box(L1+L2+L3, -wg_width/2+d/2, L1+L2+L3+wg_length, wg_width/2+d/2);
output_wg_poly_2 = pya.Box(L1+L2+L3, -wg_width/2-d/2, L1+L2+L3+wg_length, wg_width/2-d/2);

# create the shape
self.cell.shapes(self.l_layer).insert(center_region)
self.cell.shapes(self.l_layer).insert(input_wg_box)
self.cell.shapes(self.l_layer).insert(output_wg_poly_1)
self.cell.shapes(self.l_layer).insert(output_wg_poly_2)
...
`
From geometry perspective the structure should be ok.
However, the actual appearance turns out to have roughnesses:
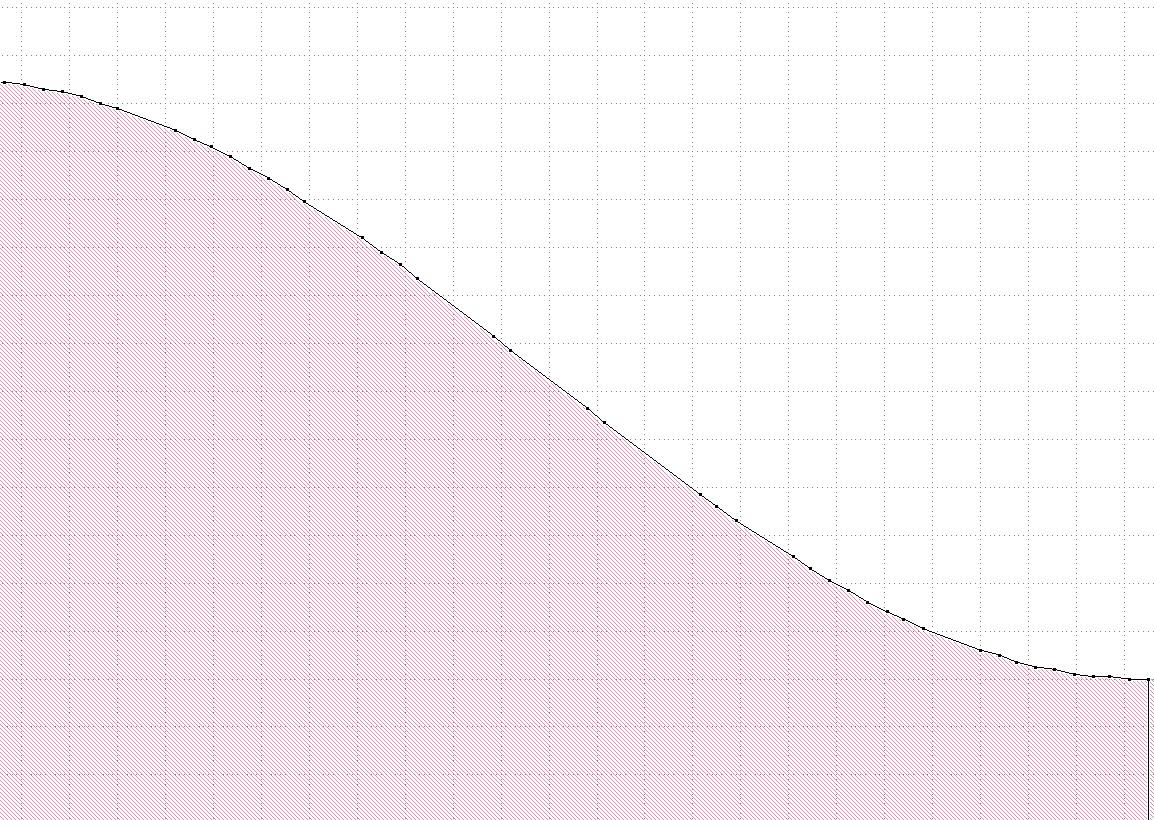
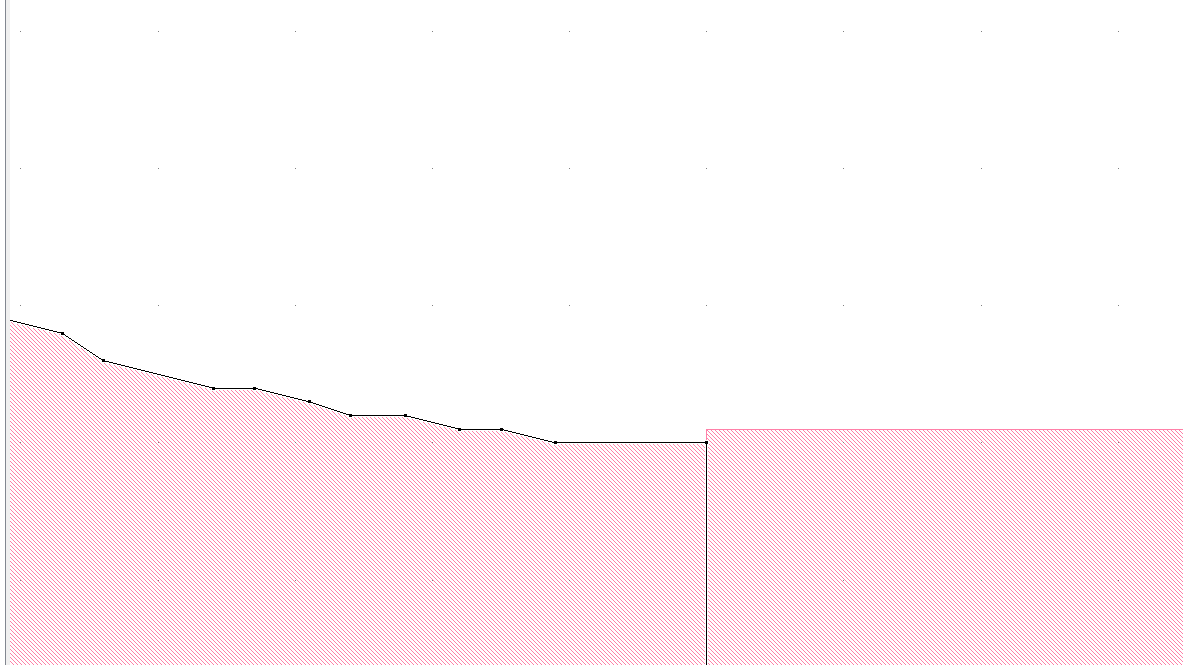
I wonder, how can I figure out the problem.
Comments
Hi Mikhail, typical IC layout databases have a pre-defined grid, typically 1nm. The data is stored as integer number of grid points, not real numbers. So at some point from a sine to GDSII or Oasis, the layout will be grid-snapped. I am not sure whether Oasis supports anything more sophisticated. Grids are typically "order of magnitude" numbers, e.g. 5nm or 1nm, depending on technology.
Hi, ejprinz!
Thank you for answer. Indeed, the grid size was set to 10 nm.
However, now, after changing the grid for 1 nm in "File->Setup->Grid",
the situation is the same. I tried creating a new layout and placing the same PCell into it,
but it didn't help.
Note that if I create a circle from the basic library, its appearance is all right when flattened. The characteristic size of the curves is on the order of 100-200 nm.
Is there any way to overcome this?
Hi Mikhail,
"grid" does not change the database unit. That's done in "File/Layout Properties".
By default the database unit is 1nm as Erwin mentioned. When you have feature with dimensions of 100-200 nm and expect a certain smoothness, you should consider going down to 0.1nm (0.0001µm).
Although the DPoint etc. objects use floating-point units these are internally converted to DBU multiples. Rounding happens by rounding to nearest. This means if you have values of lets say 100.5nm and a DBU of 1nm, the resulting coordinate may be at 100 or 101nm. A little computation error can make this difference. So as a general advice, the widths and heights you enter should be multiples of 2*DBU so the final computed coordinates round to DBU multiples.
Matthias
Thank you, Matthias